Ditel Studio manual
This manual explains, without assuming any prior technical knowledge, which devices Ditel Studio can read and control, how each value is represented as a widget on a dashboard, how alarms work, and how everything connects to the Ditel Broker to take data beyond the plant.
1 The ecosystem, at a glance
A common problem in industrial environments is having data scattered across very different sources (PLCs, analyzers, web services, even values only the operator knows), needing to act on them without depending on internet being available at that exact moment, and also needing to see them and get alerted outside the plant. Ditel Studio and the Ditel Broker each solve one half of that problem:
- Ditel Studio solves the plant: it reads, controls, and displays the data where it happens, without depending on any external server to work.
- The Ditel Broker solves the distance: it stores history, applies rules across different locations, and alerts people who aren't in front of a screen.
Besides reading, Ditel Studio lets you control: create buttons that write to the device remotely — activate an output, change a setpoint, force a Modbus register (see Action button, 6.6, and Modbus button, 6.7).
The diagram below shows how Ditel Studio connects its data sources —detailed in the device catalog, section 2— with on-screen representation via widgets (section 6), alarms (section 7), and the output gateways toward the Ditel Broker (section 8).
Acquisition
- Polling engine
- Live variable registry
- Configurable dashboards
- Alarm engine
- History and export
Display
Alarms
Gateways
2 Device catalog
Each block in the diagram above groups specific devices. This section details what each one is, what it's for, and how it connects to Ditel Studio.
2.1 Acquisition devices
These are the data sources Ditel Studio can read. They cover both Ditel's own range and any third-party equipment or service.
- Micra Max
- Universal process indicator (scale, temperature, flow, or any analog signal) with a built-in webserver. Ditel Studio connects to it in two ways, chosen per installation: the device's own REST API or standard Modbus TCP/IP. It exposes the display value, historical min/max, setpoints 1–4, and control actions such as tare or reset.
- IONA Multisensor
- Multi-parameter station with interchangeable probes and its own REST API. Reports up to 15 simultaneous variables: CO₂, temperature, humidity, PM1.0/PM2.5/PM4.0/PM10 particulates, differential pressure, and numeric particle concentration (#/cm³).
- IONA Basic
- The traditional version of the same sensor, with a built-in REST API, focused on the three most common environmental variables: temperature, relative humidity, and CO₂ as an optional measurement.
- Generic Modbus TCP/IP device
- Any third-party industrial equipment that speaks Modbus TCP: PLCs, drives, energy meters, smart sensors. Ditel Studio reads Holding Registers (4x), Input Registers (3x), Coils and Discrete Inputs, with support for the U16, I16, U32, I32, F32, and Bool data types.
- REST API — public or private
- Any service with an HTTP/REST output, whether inside or outside the industrial environment: a stock-quote API, a weather service for a region or country, or the position/status exposed by an ERP or CRM. It's represented and alarmed with the same logic as a Modbus value.
- Manual entry
- A value typed directly by the operator, for data with no automatic source (for example, a manual count or a reading from equipment without communications).
Ditel Studio's REST connector isn't limited to the industrial domain: as a generic API consumer, it accepts sources with very different formats and treats them with the same representation and alarm logic as a Modbus value. This lets you combine, on the same dashboard, a plant variable alongside a market quote or an external weather condition.
2.2 Display devices
Physical large-format panels for showing values on the plant floor, visible from a distance.
- Large-format DTPM
- Alphanumeric plant sign (DMG, DMA, DMN series). Besides numeric values, it supports text and messages, useful for setpoints, warnings, or the variable's name next to the value.
- Large-format numeric displays
- Display dedicated to figures (DN/NB, DT/NE series), designed for purely numeric readings from a distance: production, temperature, a counter.
2.3 Alarm devices
- IOSB1 wristband
- Bluetooth (BLE) wristband that vibrates the moment an alarm configured in Ditel Studio triggers, notifying the operator without them having to look at a screen. Reports battery level and signal status live.
2.4 Output gateways
Widgets that let you take the data outside Ditel Studio, to a file or to the cloud. Explained in detail in Datalogger (6.8) and MQTT Gateway (6.9).
- MQTT Gateway
- Publishes the value as an MQTT message to an MQTT server, local or in the cloud — typically the Ditel Broker. It's Ditel Studio's entry point into the ecosystem's central layer.
- Datalogger
- Exports the data to a CSV or JSON Lines file. The simplest option for keeping a historical record, with no dependency on network or any server.
3 What a widget is and what it's for
A dashboard is a screen you assemble yourself, placing on it the variables you want to keep an eye on from your devices (for example, a room's temperature, humidity, a sensor's status, etc.). Each of those "cards" you place on the dashboard is a widget.
Not all widgets do the same thing. Some simply display a value (a number, a clock-style needle, a level bar), others draw how a value has evolved over time, others carry out an action when you press a button (for example, activating a relay), and others work in the background storing data in a file or sending it to another system, with no need to keep them visible on screen.
Which widget to use depends on what you need to see or do with that data. This manual helps you decide and fill in each form field correctly.
4 How to add a widget to a dashboard, step by step
- Open the dashboard you want to edit (or create a new one) and enter edit mode.
- In the panel on the right, first choose the Device whose data you want to display. All the devices you already have configured in the application appear here.
- Depending on the device type chosen, a Variable field will appear (to choose exactly which data to display) or a "Configure Modbus register…" button if the device is Modbus type.
- Choose the Widget type: here you decide how you want to represent that data. Section 6 of this manual explains each one to help you choose.
- Fill in the fields for that widget type (explained in section 5 and in each subsection of section 6).
- Press "Add widget". The widget is added to the list on the left and appears on the dashboard.
- To modify an existing widget, press the pencil (edit) icon on its row in the list on the left. The button will change to "Save changes". To undo the edit, press "Cancel edit".
- To delete a widget, press the trash icon; you'll be asked to confirm before it's removed.
- To duplicate a widget, press the duplicate icon.
- When you're done, press "OK" to save all dashboard changes, or "Cancel" to discard them.
The widget list on the left and the form on the right are separated by a bar you can drag with the mouse, to widen whichever side you need to see better.
5 Fields found in (almost) every widget
These fields repeat across most widget types. They're explained here once so they don't need repeating in every section.
- Position / Size
- Determine where the widget sits on the dashboard grid and how much space it takes up. "Col" and "Row" are the position (starting at 0). "Width" and "Height" are how many grid cells it occupies in each direction. If you're not sure what values to use, try the defaults and adjust afterwards by checking the result — it's fine to try a few times.
- Title
- The text heading the widget's card. If left empty, the chosen variable's name is used automatically. Write something clear, e.g. "Server room temperature" instead of just "temp1".
- Minimum / Maximum value
- Define the variable's expected range (e.g. 0 to 100 degrees). The gauge, bar, or chart use these two numbers to draw the scale. If the range is wrong, the drawing will look "flattened" or the needle will barely move — check that it matches your variable's real values.
- Color
- The color the value or button is drawn in. Press the color button to open the picker.
- Orientation
- Only on some widgets (like the VU Meter bar). Indicates whether it's drawn vertically or horizontally.
- Button text
- Only on button-type widgets. The text the end user will see written on the button, e.g. "Activate pump" or "Reset".
- High / Low alarm
- See section 7, dedicated entirely to explaining alarms.
6 The widgets, one by one
6.1 Numeric value
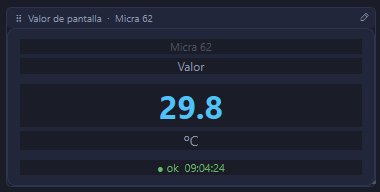
What it does: displays the variable's value as a large, easy-to-read-from-a-distance number, along with its unit (e.g. "23.5 °C").
When to use it: it's the simplest widget, ideal when all you need is to read a specific value at a glance, with no charts or needles.
Fields to fill in: the common ones (Title, Color). It has no additional fields of its own.
6.2 Circular gauge (speedometer)
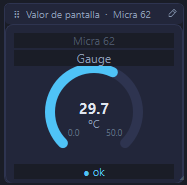
What it does: draws a car-speedometer-style needle that moves according to the variable's value, between the "Minimum value" and "Maximum value" indicated.
When to use it: when you want a visual, intuitive read of "how much is left" for a variable within its normal range, e.g. a tank's level or a pressure.
Fields to fill in: the common ones (Title, Color, Minimum value, Maximum value). It's essential to set the minimum and maximum correctly, or the needle will always sit at one end.
6.3 Zoned color gauge
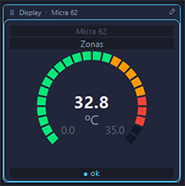
What it does: it's the same as the circular gauge above, but the background arc is also painted in three colors (green, amber, and red) depending on how close the value is to its limits, acting as a visual traffic light.
When to use it: when you want anyone to know, just by looking at the color, whether the value is in a safe, cautionary, or danger zone, without having to read the number.
Fields to fill in: the same as the regular gauge (Title, Color, Minimum value, Maximum value).
Note: the exact percentages where the amber and red zones start are fixed internally by the application; if you need different thresholds, ask whoever maintains the application.
6.4 VU Meter bar
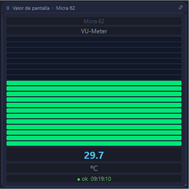
What it does: displays the value as a bar of lit-up segments, just like a music equipment's volume indicator. The more segments lit, the higher the value within its range.
When to use it: a visually more "industrial" alternative to the circular gauge, useful in panels where you want several bars together taking up little horizontal space.
Fields to fill in: the common ones (Title, Color, Minimum value, Maximum value, Orientation). With "Orientation" you choose whether the bar grows upward (vertical) or to the right (horizontal).
6.5 Historical chart
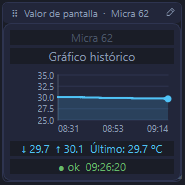
What it does: draws a line showing how the variable's value has changed over time (the last 24 hours), instead of only showing the current value.
When to use it: when what matters isn't just "what's the value now" but "how has it evolved", e.g. to see if a temperature has been gradually rising throughout the day.
Fields to fill in: the common ones (Title, Color, Minimum value, Maximum value). The minimum and maximum define the chart's vertical axis limits: if they don't match your variable, the chart will look like a flat line stuck at the bottom. Always adjust them to the real range.
6.6 Action button
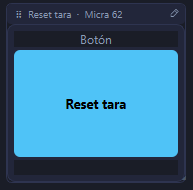
What it does: shows a button that, when pressed, sends a command to the device (for example, to activate or deactivate something the device itself offers as a configurable "action", not a simple reading).
When to use it: only makes sense when, when choosing the variable, it's an "action" type (the application detects this on its own and switches the form to this mode).
Fields to fill in: Title (optional) and Button text (what the operator will read written on the button, e.g. "Run").
Note: this type of button isn't meant for Modbus devices — for those, use the "Modbus button (FC05)" in the next section.
6.7 Modbus button (FC05)
What Modbus is, in a nutshell: it's a language widely used in industry for a computer to communicate with automatons, relays, and controllers. One of that language's "verbs" (technically identified as "function 05") is used to switch a remote switch inside the device on or off — that remote switch is called a "coil".
What this widget does: shows a button that, when pressed, sends the command to turn that Modbus device's remote switch (coil) on, off, or toggle it.
When to use it: when your device is Modbus type and you need a button to activate a relay, do a reset, or any remote on/off switch on the equipment.
Fields to fill in:
- Coil address
- The number (in hexadecimal, with the "0x" prefix already in the form) that identifies exactly which switch on the device you want to operate. It must be provided by the equipment's manufacturer or whoever configured the device — it's not something you can guess.
- Action on press
- ON (always turns it on), OFF (always turns it off), or Toggle (switches between on and off each time you press it).
- Button text
- The text the operator will see on the button, e.g. "Reset" or "Activate pump".
- Color
- The button's color.
6.8 Datalogger (file logging)
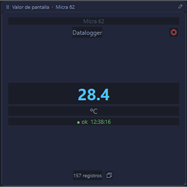
What it does: besides showing the last value read, it automatically stores every reading in a file on disk (in CSV format or JSON Lines format). The file "rotates" on its own when it grows too large or the day changes, so you never end up with a single giant file.
When to use it: when you need an exportable history of a variable to analyze later in another tool (Excel, a report, etc.).
Fields to fill in:
- Output folder
- The folder where the files will be saved. Press "…" to choose it with the file explorer.
- File prefix
- The name the generated files will start with (e.g. "room2_temperature_20260716_001.csv"). If left empty, the variable's name is used.
- Unit
- The unit noted next to each saved value (e.g. "°C"). If left empty, the device's own unit is used, if it has one.
- Format
- CSV: comma-separated columns, ideal for Excel. JSON Lines: designed for other programs to read the data automatically.
- Rotate above (MB)
- When the active file reaches this size, it's closed and a new one starts automatically.
- Also rotate every day
- If checked, a new file starts every time the day changes, even if the previous size hasn't been reached.
Buttons on the card: the datalogger shows two large buttons, Record and Pause, to temporarily stop logging without deleting the widget. It also has small buttons to copy the active file's path, open it in Notepad, or open its folder.
The datalogger keeps recording even if the widget isn't visible on the dashboard screen at that moment. It doesn't need to be in view to keep working.
6.9 MQTT Gateway (sending to an MQTT broker)
What MQTT is, in a nutshell: it's a system for sending small data messages over the internet or a local network, to a central "meeting point" called a broker. Each message is sent to a specific label called a topic, and any other program listening to that same label receives the message.
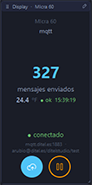
What this widget does: besides showing the last value read, it automatically sends it to the MQTT broker you configure, every time the data updates. It's the equivalent of the datalogger, but instead of saving to disk, it sends the data to another system over the network.
When to use it: when you need another system (a cloud platform, other software, an external panel) to receive in real time the data Ditel Studio reads.
Data source: configured exactly like any other widget (Device and Variable, at the top of the form). That's independent from "where it's sent to", explained below.
Fields in the "MQTT Output" section:
- Server
- The broker's address, e.g. a local IP (
192.168.1.10) or a server name (broker.ditel.es). Whoever administers that broker must provide it. - Port
- Default value 1883, which automatically changes to 8883 if you enable TLS. Only change it if the broker's administrator tells you to use another number.
- Topic
- The label within the broker the messages will be sent to. If you're sending data to the Ditel broker (broker.ditel.es), the topic must be exactly:
your_email/ditelstudio/variable_name. For any other broker, the topic is free-form. - Username / Password
- If connecting to the Ditel broker, these are mandatory: without them, the broker will refuse the connection. For other brokers it depends on their configuration.
- Security
- "Unencrypted (TCP)", the simplest option on trusted internal networks, or "TLS", which encrypts the communication. Ask the broker's administrator which one is required.
- Custom CA certificate
- Only appears with TLS. You can usually leave it empty. Fill it in only if the broker uses a "non-official" certificate (common on brokers installed inside a factory).
- Don't verify certificate/hostname
- Only with TLS. An advanced option meant only for fully trusted internal networks — never check it when connecting to a broker over the open internet.
- QoS
- 0 (no confirmation, fastest, fine for most sensor readings), 1 (delivered at least once) or 2 (delivered exactly once, the slowest). Leave it at 0 unless you have a reason to change it.
- Retain last message
- The broker keeps the last data sent and delivers it immediately to any system that connects later to that topic.
What you'll see on the card: the number of messages sent so far, the last value read, and a connection indicator ("connected"/"disconnected", with the failure reason if any). It has the same Send / Pause buttons as the datalogger.
The sending frequency isn't configured here: a message is sent every time the device updates its reading, and that frequency is set in the device's own configuration.
To see what the Ditel Broker does with these messages once they arrive (history, rules, Telegram/email alarms, remote panels), see section 8, The Ditel Broker.
Just like the datalogger, the MQTT Gateway keeps sending data even if the widget isn't visible on screen. If the connection to the broker is lost, the system retries on its own.
7 How alarms work
Almost every widget that shows a numeric value (except buttons) lets you define a high alarm and/or a low alarm. When the value exceeds the high limit, or falls below the low limit, the widget's card starts flashing. The flashing stops once the value is back within normal limits.
For each limit you can choose:
- A fixed number typed by hand — leave the limit empty if you don't want that alarm checked.
- Or use the value of another variable on the same device — useful when the device has a configurable "setpoint", and you want the alarm to trigger relative to that setpoint instead of a fixed number.
Buttons (action or Modbus) have no alarms, because they don't represent a numeric value that can be compared against a limit.
Besides this on-screen flashing, an alarm can also be signaled through two of the product's own physical outputs: the large-format panels (2.2) and the IOSB1 Bluetooth wristband (2.3), which vibrates when the alarm triggers without the operator having to look at a screen.
8 The Ditel Broker: consolidation, rules, and global output
Up to this point, the whole flow is local: Ditel Studio reads, decides, and acts inside the plant, with no dependency on external networks or any broker. The MQTT Gateway widget (6.9) is the only door out — and the entry point into the Ditel Broker.
The Ditel Broker is the ecosystem's central server. It receives data through two different paths and adds a layer of persistence, rule logic, and distribution that Ditel Studio, by local design, doesn't cover.
Ingestion
- Historical storage
- Dashboards
- Rule engine (if value > X → action)
- Controlled external access
External alarms
Remote output / access
8.1 Two ingestion paths
- Direct
- Micra Max devices publish directly to the Broker, without going through Ditel Studio.
- Indirect
- Ditel Studio publishes to the Broker through its MQTT Gateway widget (6.9), forwarding values it has already read (Modbus, REST, or manual).
How to configure sending to the Ditel Broker (broker.ditel.es): the Ditel Broker is, underneath, a standard MQTT broker, so the indirect path is configured like any MQTT Gateway widget (see the full field list in 6.9), with two particularities specific to this broker:
- Username / Password
- Exactly the same ones you use to log in to broker.ditel.es. Without them, the Broker refuses the connection.
- Topic
- Must follow the exact format
your_email/ditelstudio/variable_name. Thevariable_namesegment is a free identifier you choose for that specific variable. For example, if your Broker login email isemail@yourbroker.comand you want to send a temperature reading, the topic would be:email@yourbroker.com/ditelstudio/temperature_1. Important: that first segment (email@yourbroker.com) isn't just any email or a contact address — it's exactly the same email you use to log in to broker.ditel.es, so don't mistake it for a different one. - Serial number in the Broker
- When registering the variable inside broker.ditel.es, the "Serial number" field must contain exactly that same
variable_nameused in the topic. That's what lets the Broker match the incoming MQTT message to the right variable.
The "serial number" is defined per variable, not per physical device: a single device with several variables (for example, temperature and humidity from the same IONA) can send them all to the Broker by configuring one MQTT Gateway widget per variable, each with its own
variable_namein the topic and its own "serial number" registered on broker.ditel.es.
8.2 What the Broker adds
- Storage
- Persists the values received, with history that goes beyond what Ditel Studio retains locally.
- Graphical representation
- Its own dashboards to visualize how the received data evolves.
- Rule engine
- Conditional logic such as "if this value exceeds X, send an output to an MQTT panel at another location".
- External alarms
- Sends alarms via Telegram or email, independent of the local Bluetooth wristbands.
- Commands to remote panels
- Sends messages to large-format MQTT devices at any location supporting the protocol.
- External access
- Allows values to be read from outside the plant structure: third parties, other sites, integrations.
9 Why the two-layer split matters
The Ditel Studio / Ditel Broker split isn't cosmetic: it reflects a clear separation of responsibilities.
- Ditel Studio solves the plant — device reading, local control, immediate alarm (panel or wristband), with no dependency on network or on a server being available.
- The Ditel Broker solves the distance — history, rules across different locations, notification to people outside the plant, and controlled opening of that data to external systems.
This separation lets an installation run fully autonomously with just Ditel Studio (local data logging, no network), and lets the Broker layer switch on only when visibility or control beyond the plant is needed — without redesigning anything at the device level.
10 Technical summary, start to finish
- Capture
- Ditel Studio — Modbus TCP/IP, REST API (local or external: stocks, ERP, social media, weather…), manual entry.
- Local control
- Ditel Studio — Modbus / REST writes via buttons.
- Local alarm
- Ditel Studio — numeric or alphanumeric panel, Bluetooth wristband.
- Simple export
- Ditel Studio, Datalogger widget — CSV / JSON Lines.
- Connected export
- Ditel Studio, MQTT Gateway widget — to a local or cloud MQTT server.
- Direct ingestion
- Micra Max devices — direct MQTT to the Broker.
- Consolidation
- Ditel Broker — storage, dashboards, rule engine.
- Remote distribution
- Ditel Broker — Telegram, email, MQTT to remote panels.
- External access
- Ditel Broker — reading by third parties and integrations.
11 Frequently asked questions
- What happens if the device doesn't respond?
- The value simply won't update for that reading cycle; as soon as the device responds again, everything continues normally. No manual restart is needed.
- Can I have several widgets showing the same variable?
- Yes. For example, you can have a "Numeric value" and a "Circular gauge" showing exactly the same data, each with its own title, color, and range.
- Can the PC go to sleep without losing data?
- The application itself prevents the computer from automatically sleeping while it's open. Even so, if someone manually forces sleep mode, data reading will stop during that time, just like it would for any other program.
- Do I need to keep the window visible in the foreground?
- No. You can minimize it or leave it in the background: all widgets, including the datalogger and MQTT Gateway, keep working the same either way.
- Do I need the Ditel Broker to use Ditel Studio?
- No. Ditel Studio works fully on its own: it reads, controls, displays, and keeps local history without any external component. The Broker only comes into play when you need centralized history, rules across locations, or alerts to people outside the plant.
- What happens if the connection to the Broker is lost?
- Ditel Studio keeps reading, controlling, and showing alarms locally without being affected. The MQTT Gateway widget (see 6.9) retries the connection on its own as soon as it's available again.
- Can I send data to the Ditel Broker and also save it locally at the same time?
- Yes. Nothing stops you from combining, on the same variable, a Datalogger widget (local file) and an MQTT Gateway widget (sent to the Broker): they're independent widgets.